USD/CAD Price Analysis: Defends 1.2800 between 200-HMA and weekly support line
- USD/CAD struggles to extend post-Fed losses, stays sidelined around six-week low.
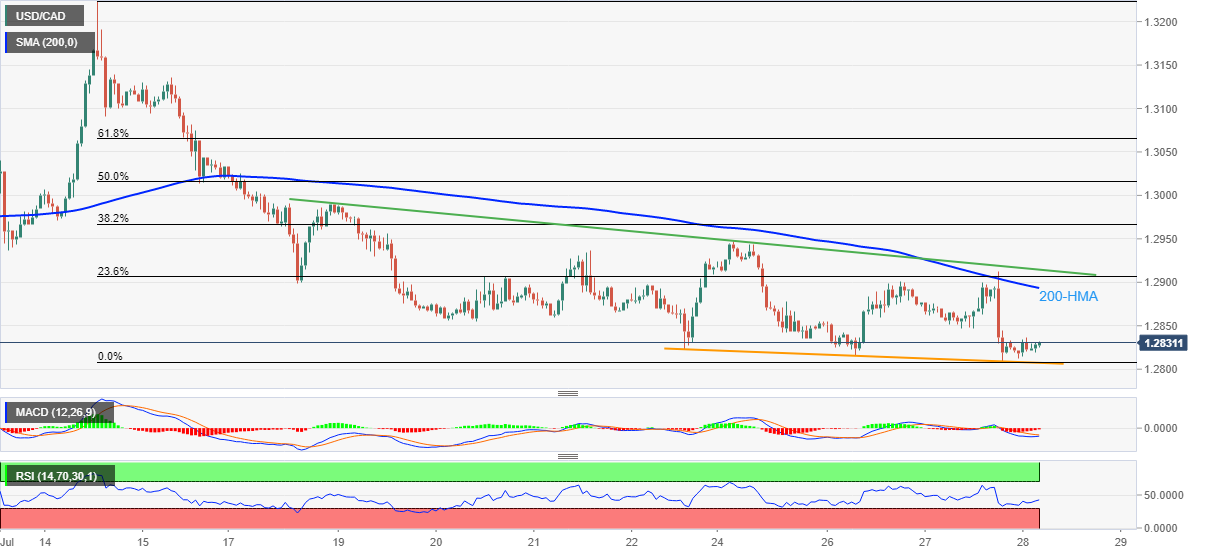
- 200-HMA restricts upside, one-week-old support line tests bears.
- Descending trend line from July 18 adds to the upside filters.
USD/CAD treats water around 1.2820-30 during Thursday morning in Europe, after refreshing the monthly low the previous day. In doing so, the Loonie pair dribbles inside a 90-pip trading area between the 200-HMA and the weekly support line.
That said, the downbeat RSI and impending bulls cross on the MACD hints at the further corrective pullback of the USD/CAD prices.
It’s worth noting that the pair’s upside break of the 200-HMA level near 1.2900 will need validation from an eight-day-old descending resistance line, at 1.2915 by the press time, to convince the bulls.
Following that, a run-up towards the weekly high surrounding 1.2950 and the 1.3000 psychological magnet can’t be ruled out.
Meanwhile, a downside break of the aforementioned support line, close to 1.2805 at the latest, should also successfully break the 1.2800 threshold to lure the USD/CAD bears.
In that case, the 61.8% Fibonacci retracement level of the pair’s April-July upside, near 1.2715, will be in focus.
Overall, USD/CAD bears seem to run out of fuel but the corrective pullback appears to have limited upside room.
USD/CAD: Hourly chart
Trend: Further recovery expected