26 Nov 2020
US Dollar Index Price Analysis: Further decline remains on the table
- DXY meets contention in the vicinity of 91.80 on Thursday.
- Immediately to the downside emerges the YTD lows at 91.74.
DXY survives around the 8-month support line in the 92.00 area and so far manages to bounce off earlier lows in the 91.85/80 band.
The outlook for the index stays bearish, in the meantime, leaving the door open to a deeper pullback to, initially, the 2020 low at 91.74 (September 1) ahead of the April 2018 lows near 89.20.
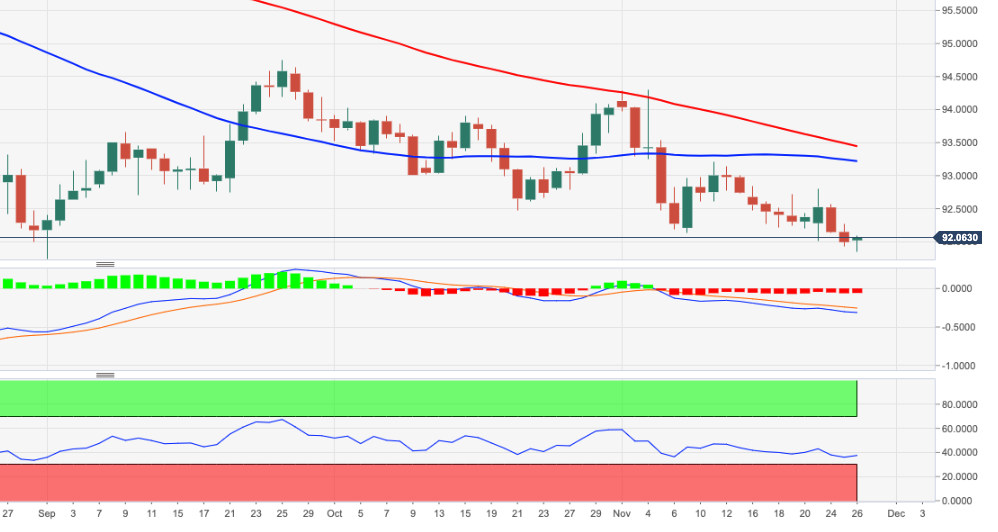
In the near-term, the selling pressure is seen mitigating somewhat above weekly highs at 93.20 (November 11). However, as long as DXY trades below the 200-day SMA, today at 96.06, the negative view is forecast to persist.
DXY daily chart