EUR/USD Price Analysis: Weekly chart suggests pullback from 3-month tops on the ECB day
- EUR/USD retreats from 1.1258 to 1.1222 as traders gear up for today’s ECB.
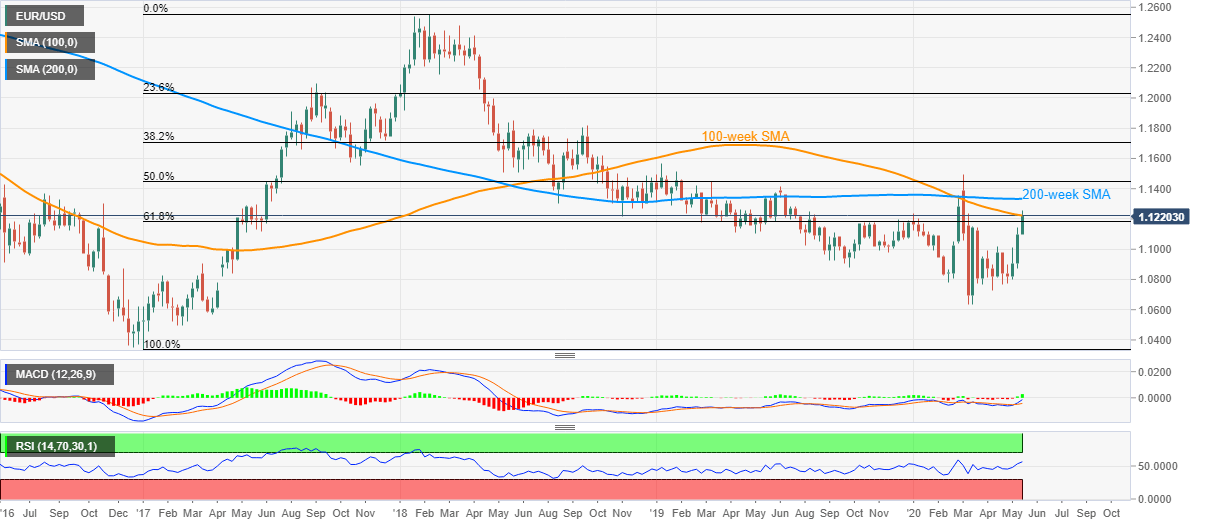
- 100-week and 200-week SMAs guard the pair’s immediate upside past-61.8% Fibonacci retracement level.
- The early-May top could offer immediate support during the further downside.
EUR/USD steps further away from the multi-day high of 1.1258, flashed the previous day, to 1.1222, down 0.11% on a day, during early Thursday.
In doing so, the quote portrays its failure to cross 100-week SMA on the day of the European Central Bank’s (ECB) monetary policy decision and press conference by Governor Christine Lagarde.
Read: ECB Preview: Lagarde's lavishness to set the tone for EUR/USD, three scenarios and what to watch
While bullish MACD and normal RSI conditions on the weekly chart suggest the pair’s further upside, a 200-day SMA level of 1.1335 could challenge the pair’s past-1.1225 immediate resistance.
Should the prices rise past-1.1335 on a weekly closing basis, March month high near 1.1500 will lure the bulls.
On the contrary, sellers will wait for entries below 61.8% Fibonacci retracement of the pair’s broad run-up from December 2016 to February 2018, around 1.1190.
In doing so, the early-May peak close to 1.0810 is likely to be the bears’ favorite.
EUR/USD weekly chart
Trend: Pullback expected