8 Aug 2019
USD/JPY technical analysis: Greenback firmer above 106.00 as Wall Street gains momentum
- The risk-off sentiment is currently on hold as Wall Street indices are at 2-day highs.
- The level to beat for bulls are seen at 106.13-25 followed by the 106.48 resistance.
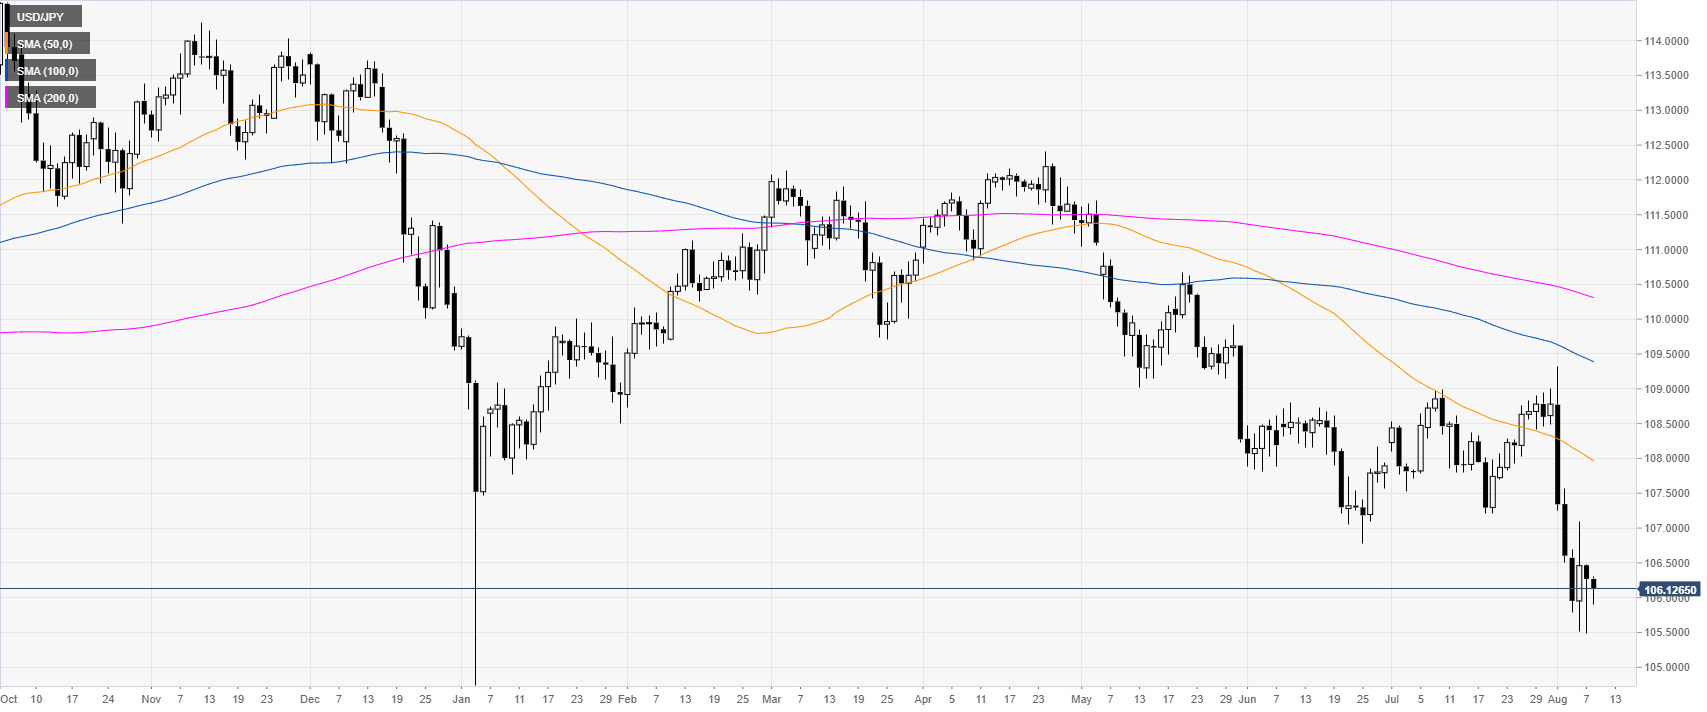
USD/JPY daily chart
USD/JPY is trading off multi-month lows while well below its main daily simple moving averages (DSMAs). USD/JPY price action is mainly dictated from trade war news.
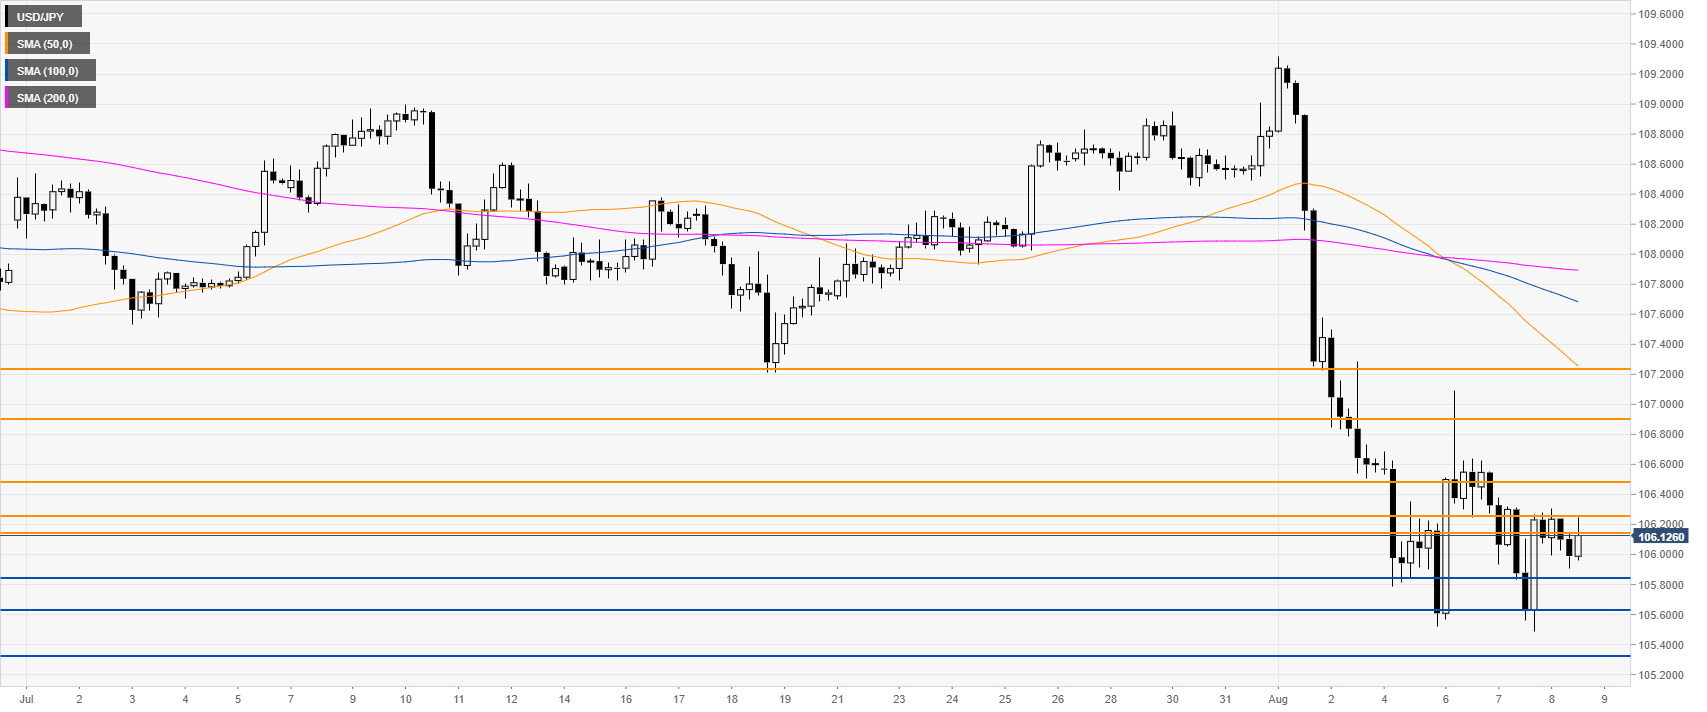
USD/JPY 4-hour chart
USD/JPY is consolidating the early August drop while trading below its main SMAs. Bears would need a break below the 105.85 to reach 105.65 and 105.30 support to resume the downtrend, according to the Technical Confluences Indicator.
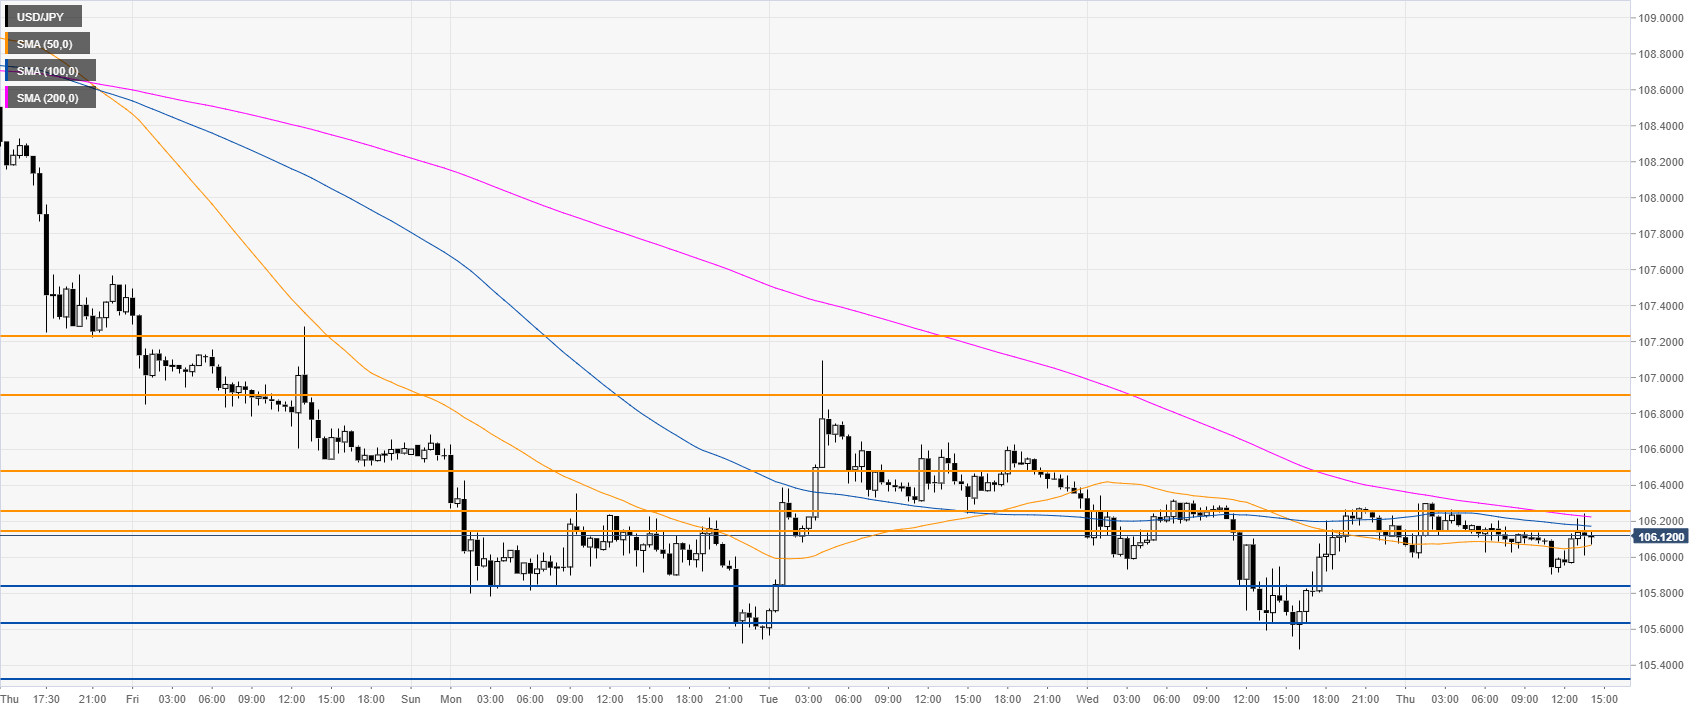
USD/JPY 30-minute chart
The market is in a tight range just above the 50 SMA. Bulls would need to break above the 106.13-25 resistance zone to climb towards 106.48, 106.91 and 107.20, according to the Technical Confluences Indicator.
Additional key levels