USD/IDR technical analysis: 50-DMA offers immediate support during recent pullback
- Little momentum between trend-line, near-term SMA.
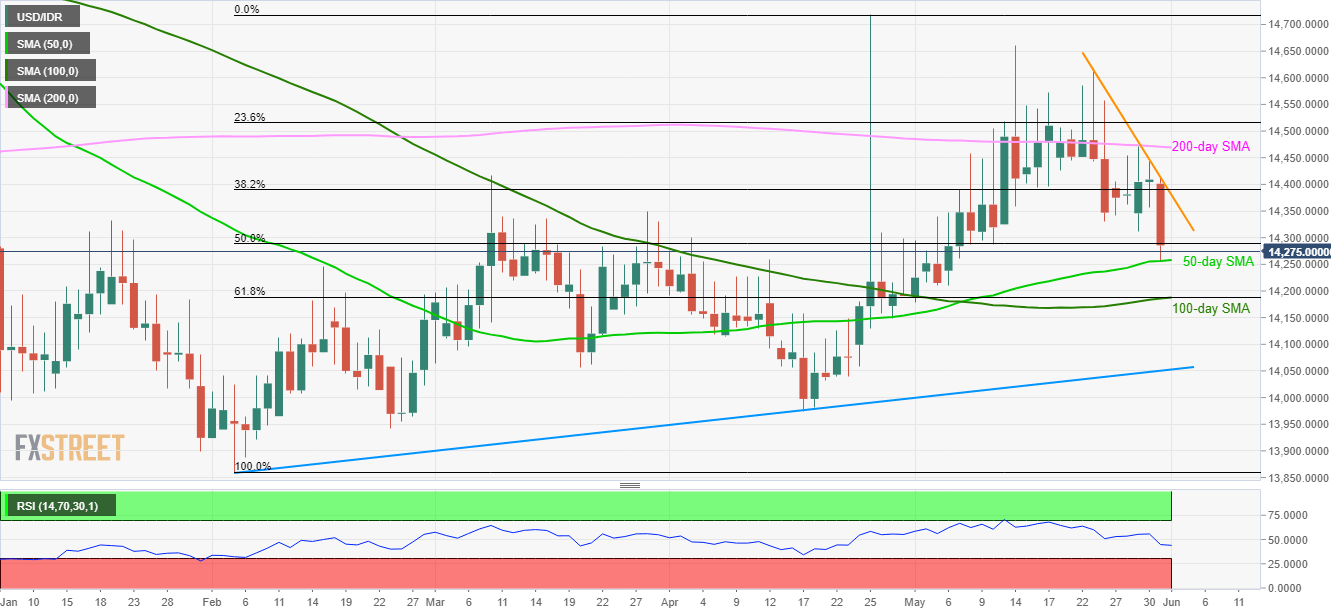
- 200-day SMA continues to challenge bulls while 14,190/85 seems strong support.
Even if short-term descending trend-line portrays the USD/IDR pair’s weakness, 50-day SMA questions sellers as the quote cling to 14,275 during the early Asian session on Monday.
That said, a downside break of 14,260/55 area comprising 50-day simple moving average (SMA) can fetch the quote to 14,190/85 support confluence including 100-day SMA and 61.8% Fibonacci retracement of February to April upside.
In a case where bears keep dragging prices to south past-14,185, 14,100 and an upward sloping trend-line connecting lows since February at 14050 may become their favorites.
Meanwhile, 14,350 and immediate resistance-line at 14,380 can restrict the pair’s short-term upside, a break of which can propel the quote towards 14,445 and 200-day SMA level of 14,470.
Should there be sustained rise beyond 14,470, 14,550, 14,620 and 14,665 may flash on the bulls’ radar.
USD/IDR daily chart
Trend: Pullback expected