
USD/JPY Technical Analysis: US Dollar bulls break above 113.60 resistance
USD/JPY daily chart
- USD/JPY is trading in a bull trend above the 200-day simple moving average (SMA).
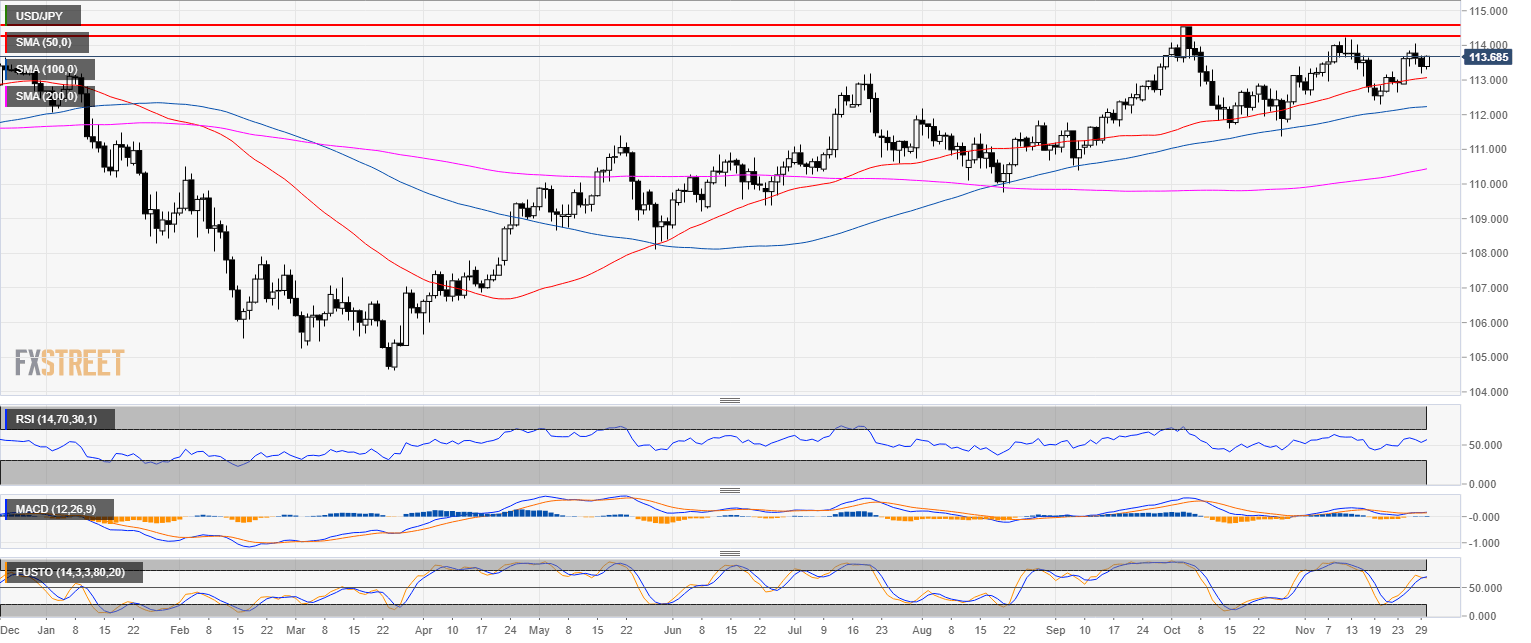
USD/JPY daily chart
- USD/JPY is resuming the bull trend as it is trading above its main SMAs.
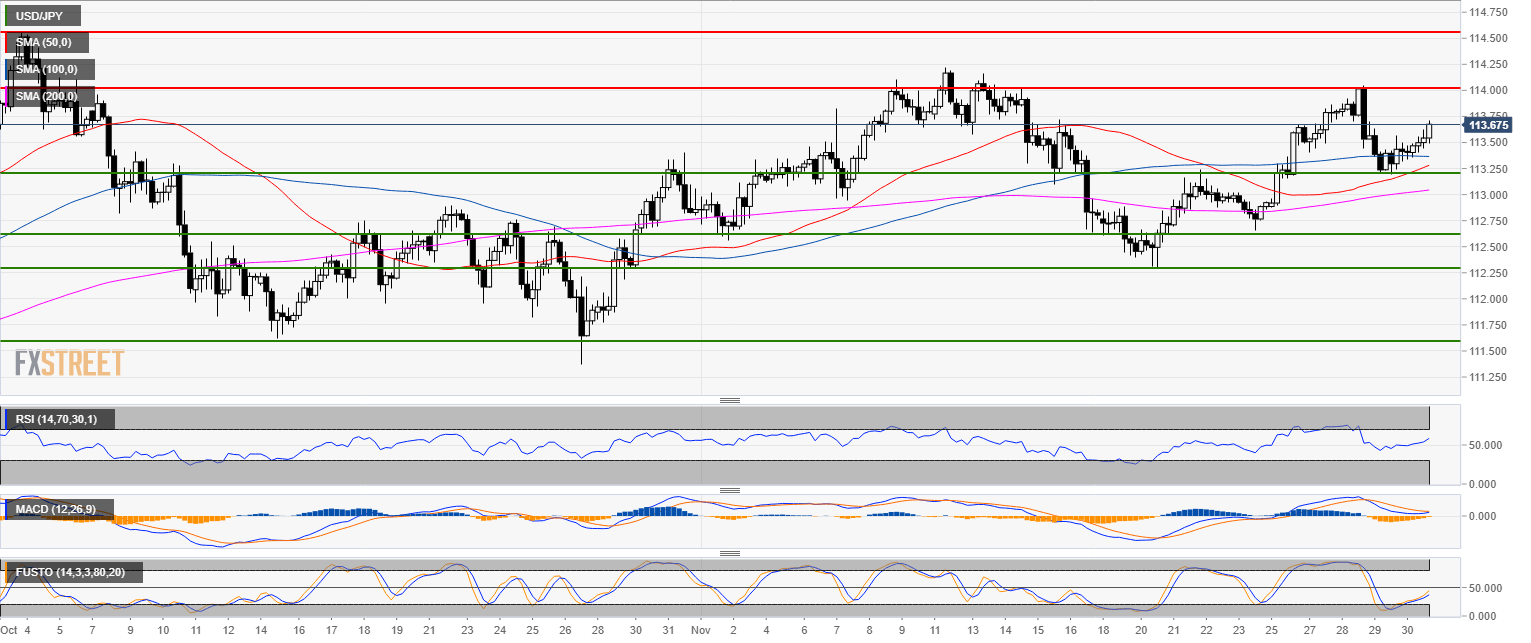
USD/JPY daily chart
- Now that 113.60 has been breached, 114.00 is potentailly the next main bull target for bulls.
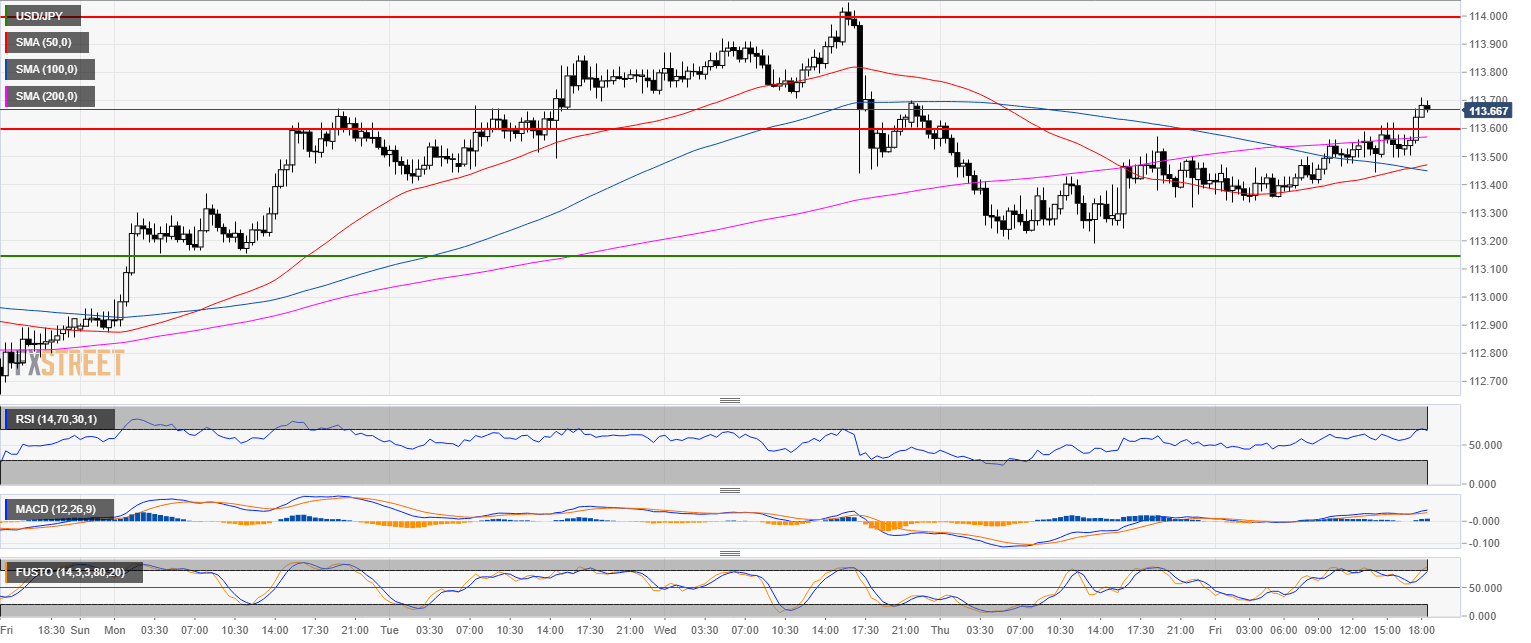
Additional key levels
USD/JPY
Overview:
Today Last Price: 113.69
Today Daily change: 30 pips
Today Daily change %: 0.265%
Today Daily Open: 113.39
Trends:
Previous Daily SMA20: 113.36
Previous Daily SMA50: 113.05
Previous Daily SMA100: 112.22
Previous Daily SMA200: 110.4
Levels:
Previous Daily High: 113.69
Previous Daily Low: 113.18
Previous Weekly High: 113.24
Previous Weekly Low: 112.3
Previous Monthly High: 114.56
Previous Monthly Low: 111.38
Previous Daily Fibonacci 38.2%: 113.37
Previous Daily Fibonacci 61.8%: 113.5
Previous Daily Pivot Point S1: 113.15
Previous Daily Pivot Point S2: 112.91
Previous Daily Pivot Point S3: 112.64
Previous Daily Pivot Point R1: 113.66
Previous Daily Pivot Point R2: 113.93
Previous Daily Pivot Point R3: 114.17