GBP/JPY Price Analysis: Shorts are vulnerable to a squeeze near daily support
- GBP/JPY bulls have stepped in on the lower time frames.
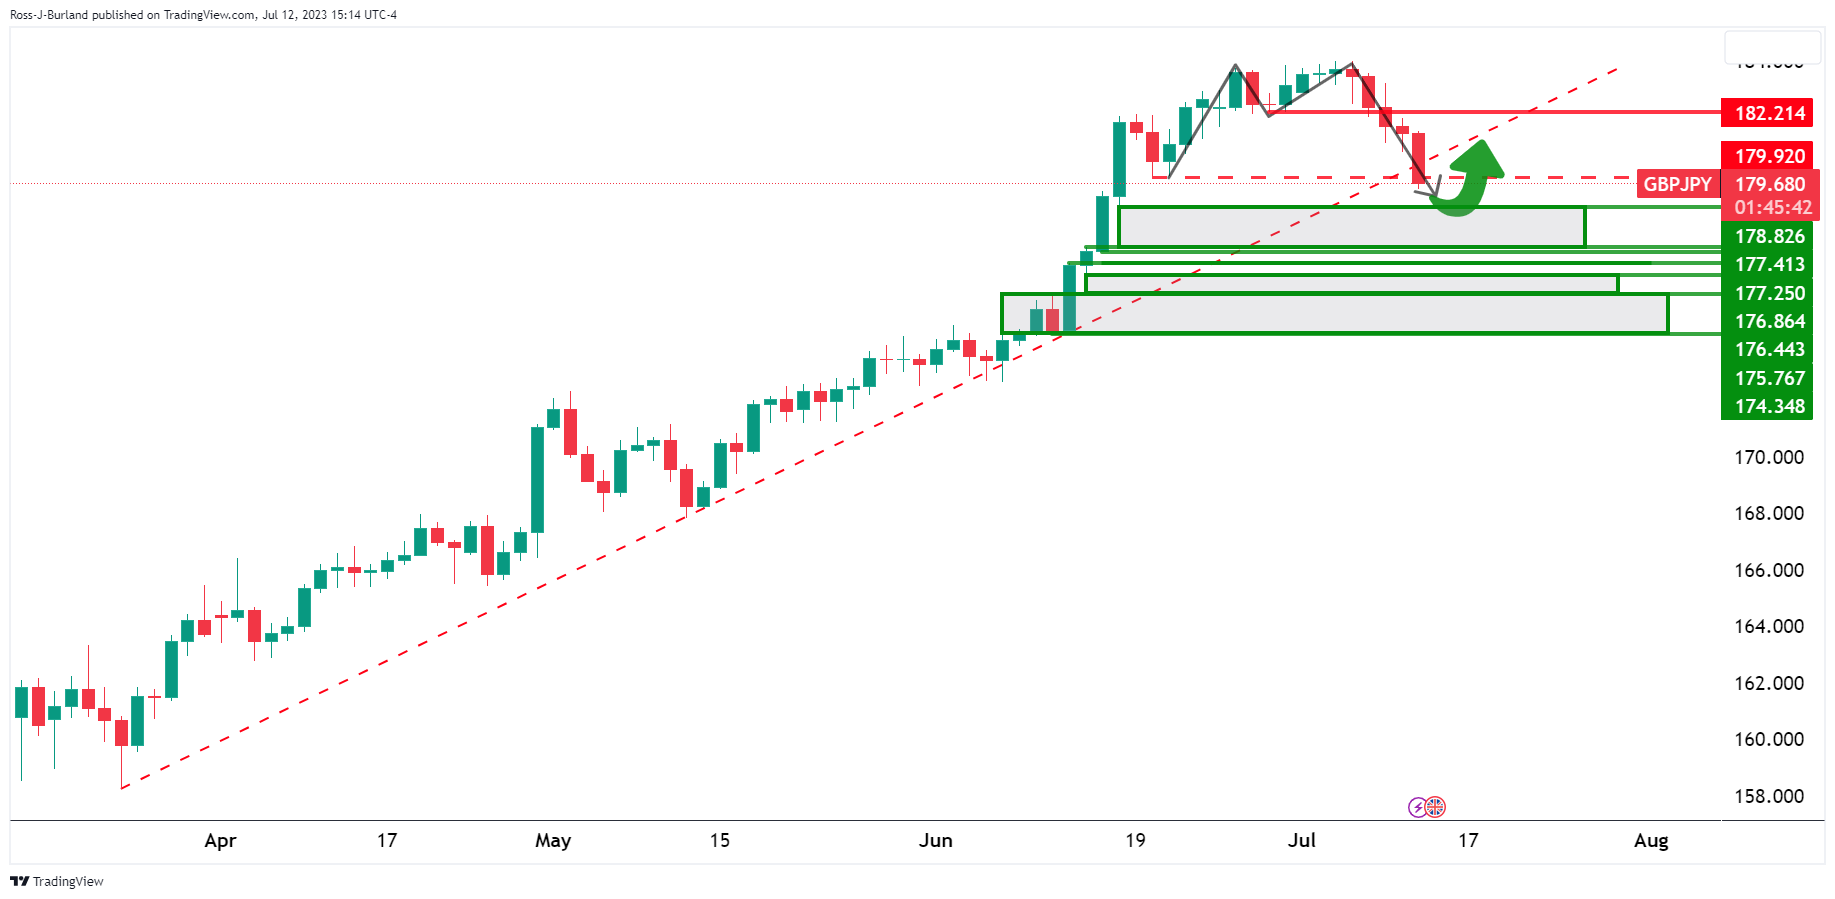
- Bulls eye a daily M-formation neckline.
GBP/JPY is down some 0.9% and has fallen from a high of 181.51 to a low of 179.46 so far. The daily chart shows the price breaking the support structure near 179.90 which puts the emphasis on the downside, medium term, but potentially supports a meanwhile bullish bias into the bearish impulse. The M-formation is a reversion pattern that would be expected to draw in the price towards the neckline.
GBP/JPY daily chart
GBP/JPY H4 chart
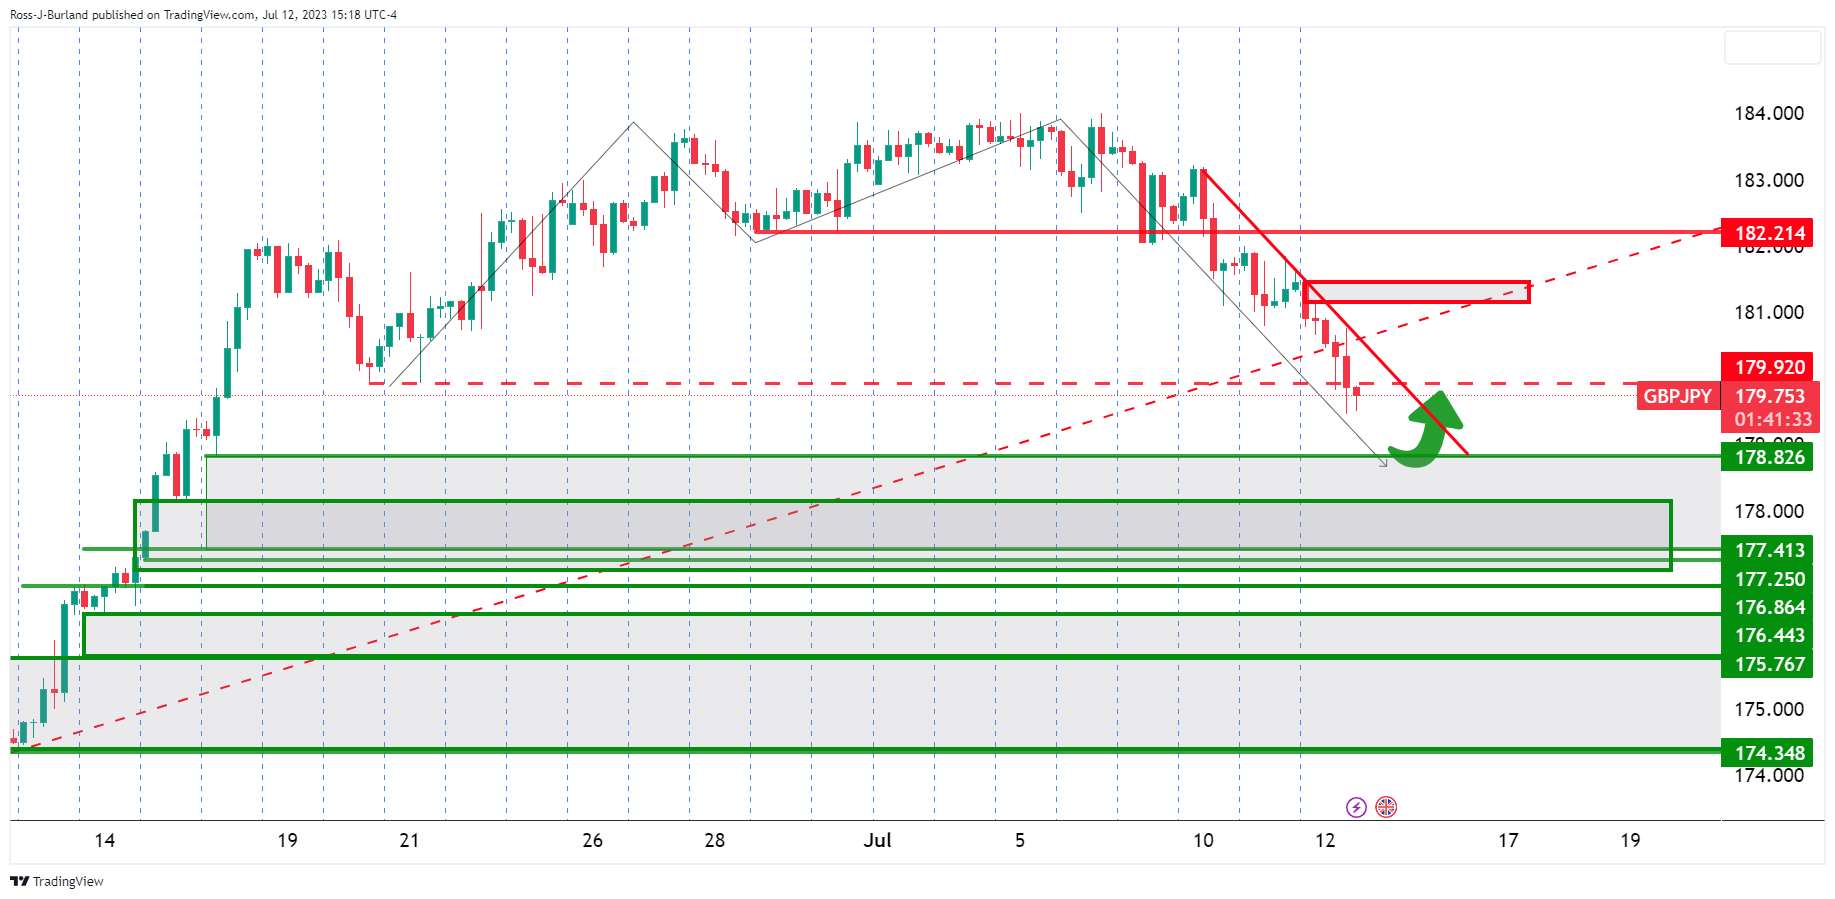
GBP/JPY 4-hour chart shows a series of bearish closes with little signs of a deceleration in the offer, so far,
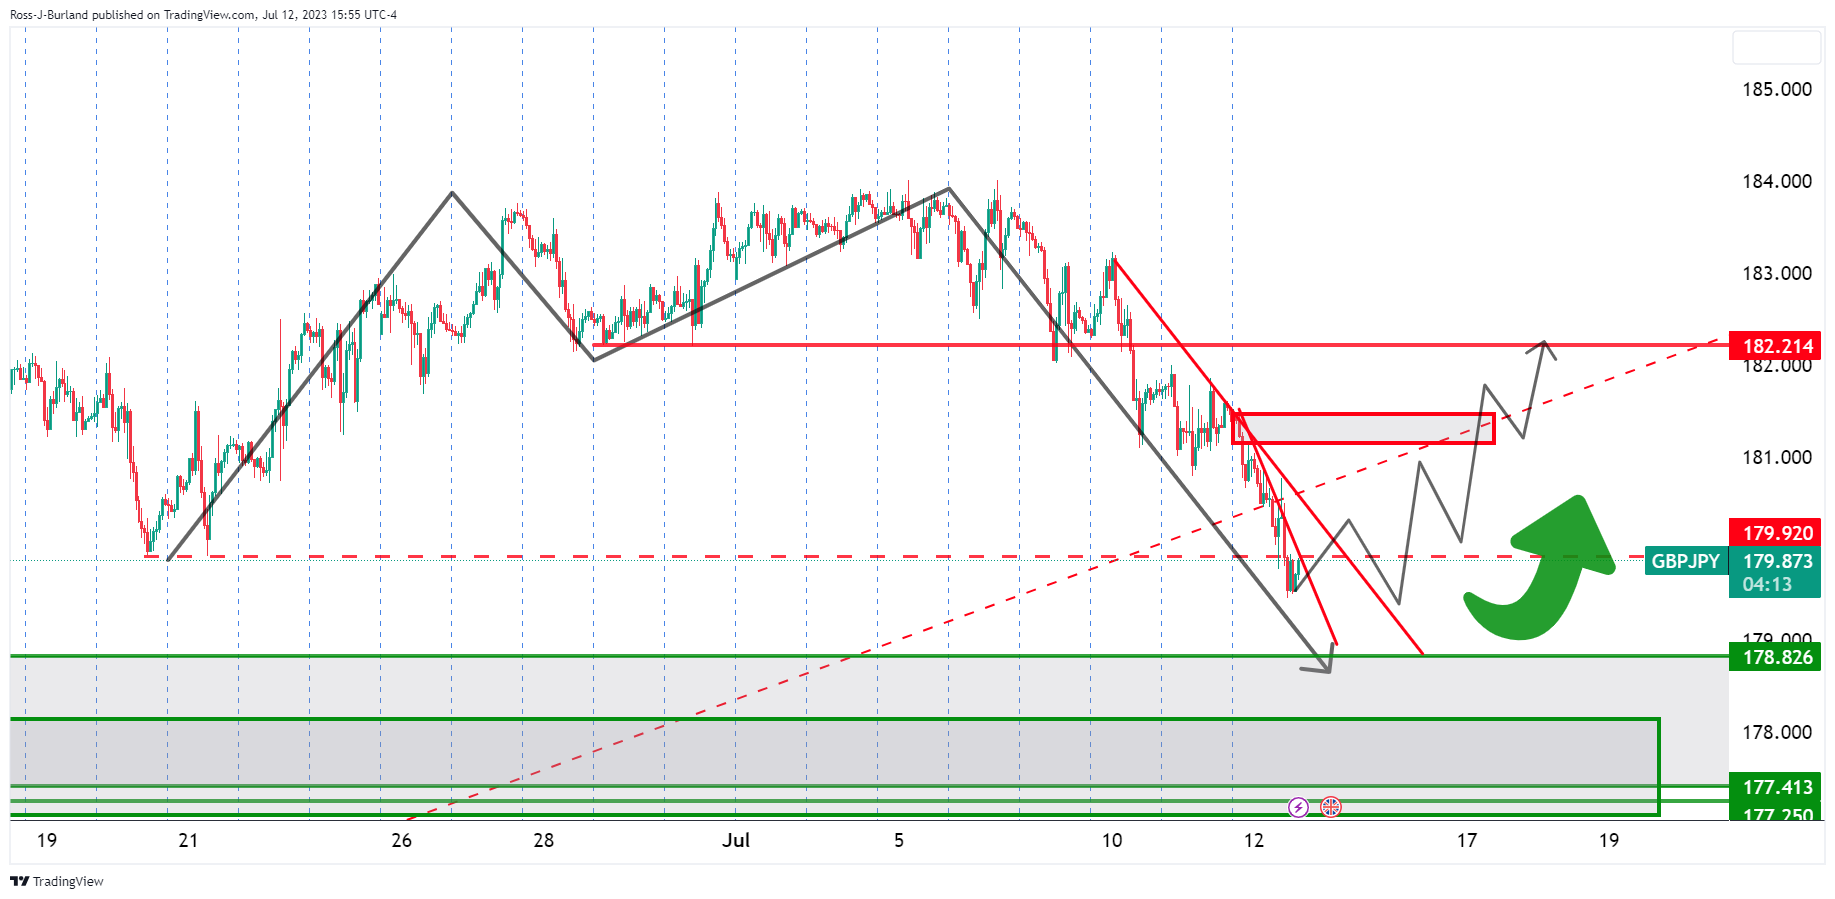
GBP/JPY H1 charts
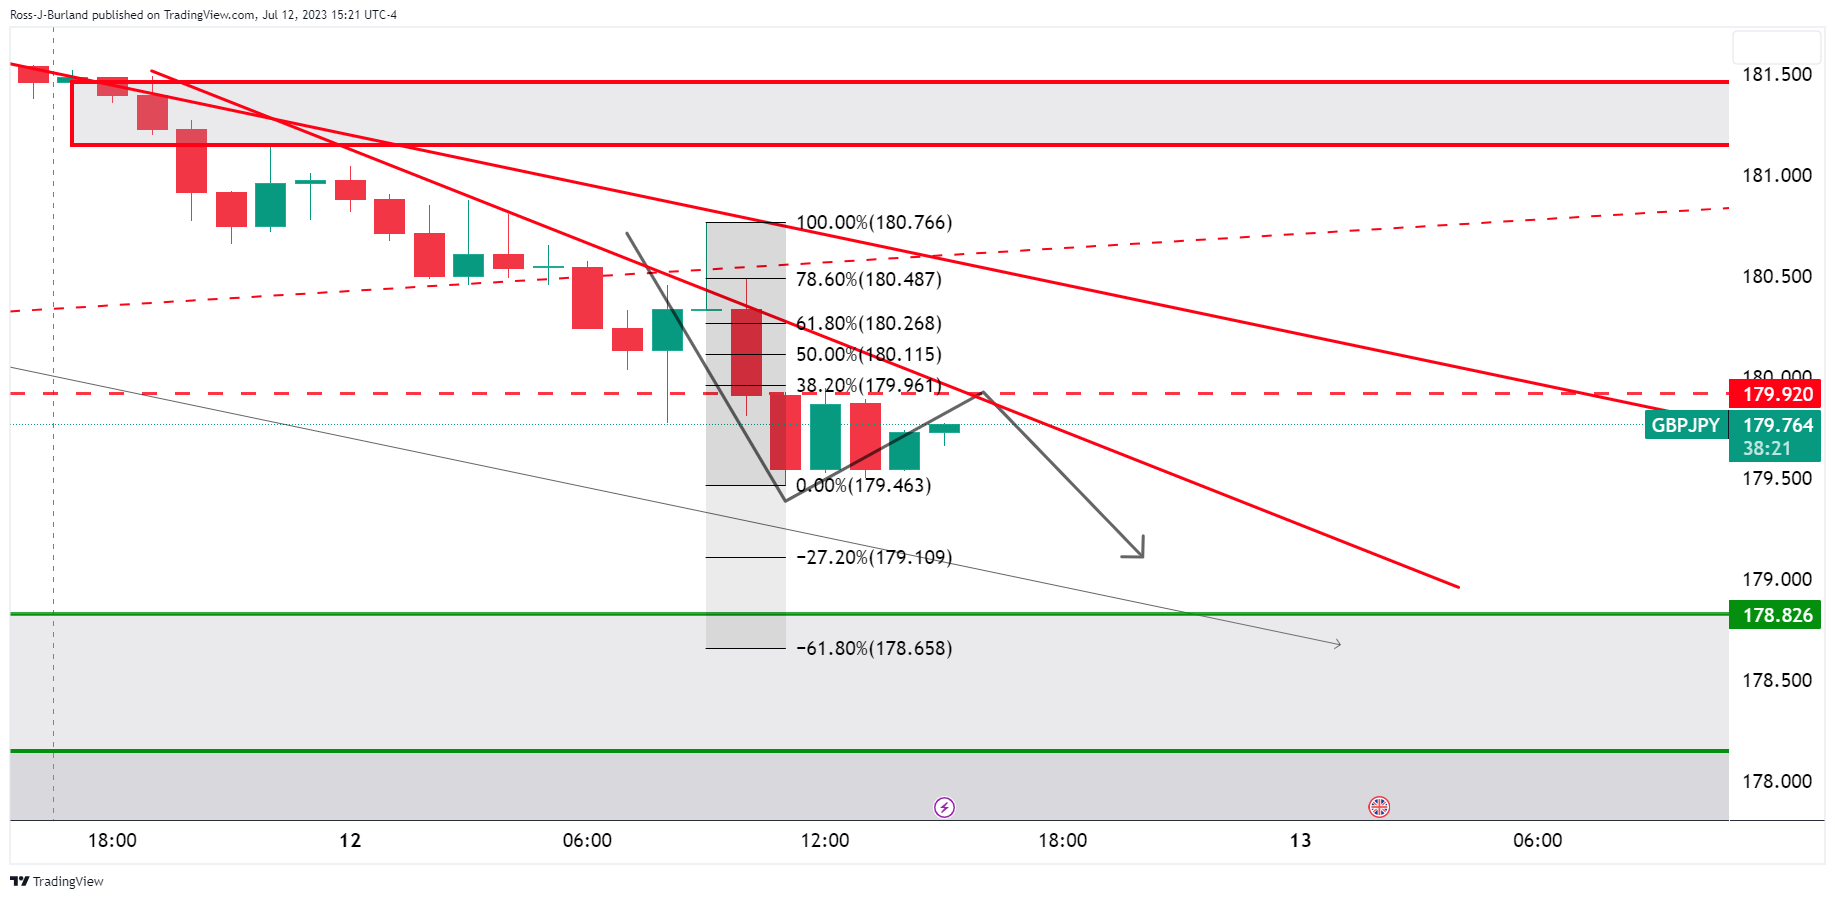
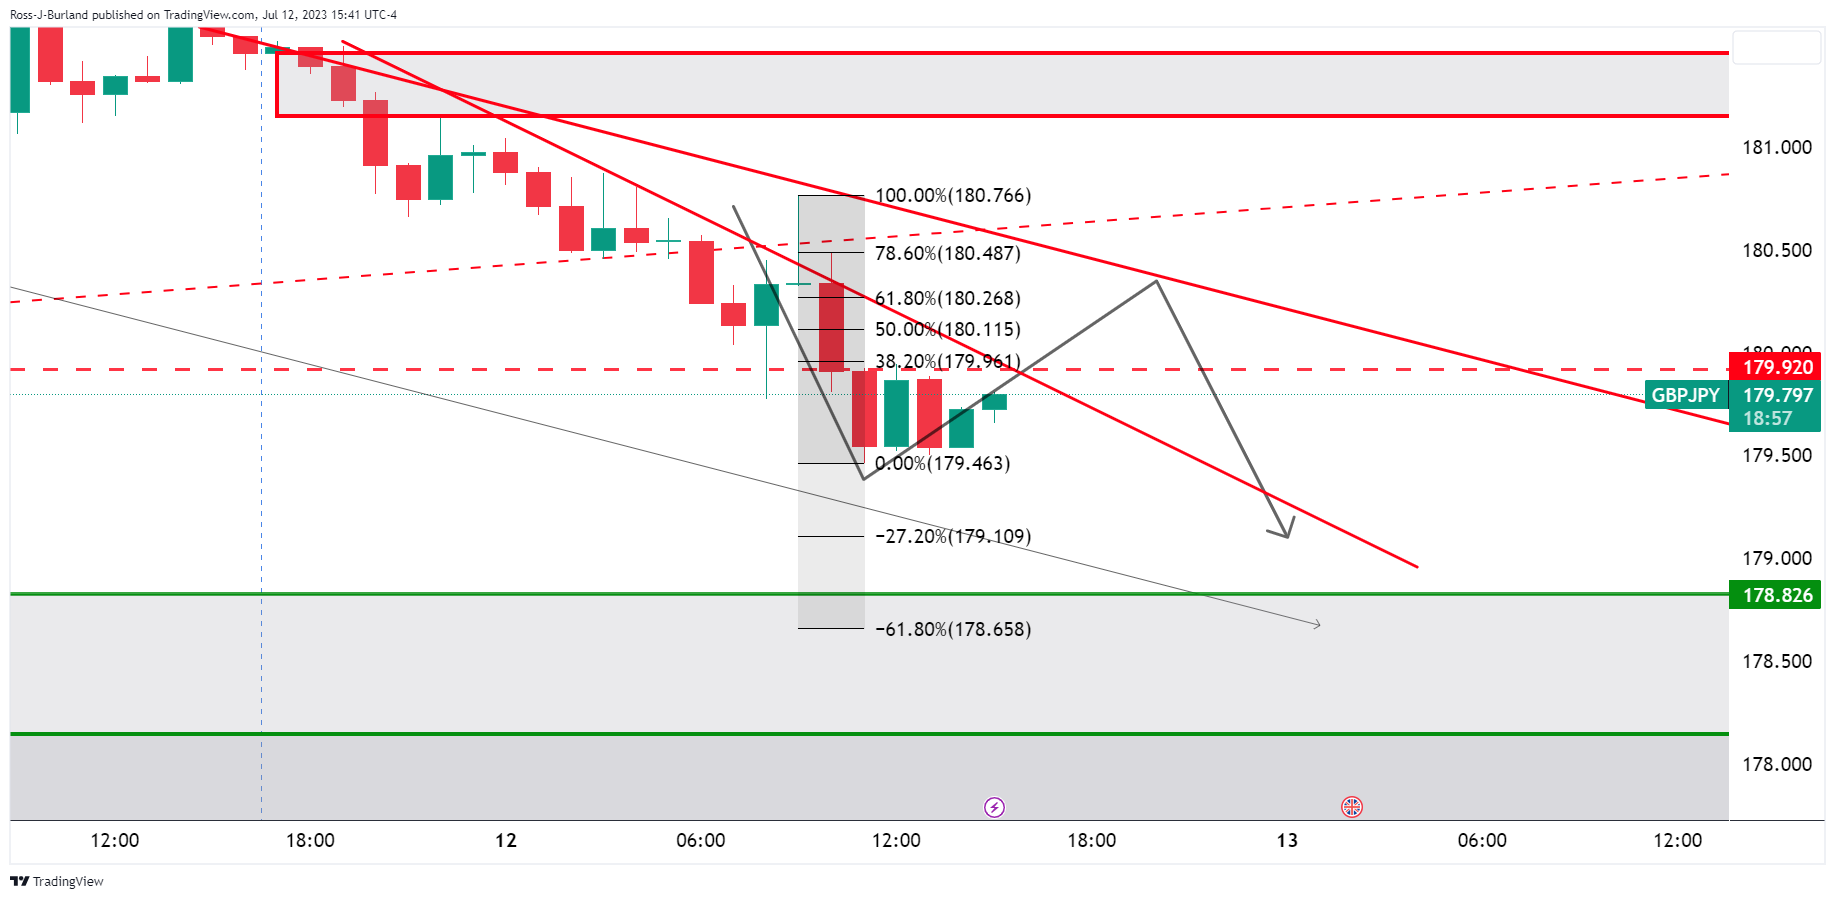
GBP/JPY hourly charts are showing that the price is decelerating on the offer and has moved into a 38.2% Fibonacci retracement of the prior hourly bearish impulse. We have two trendline resistances eyed with prospects of a move towards a 78.6% Fibonacci area near 180.50.
Meanwhile, a break of resistance opens risk to the neckline of the daily M-formation.